Listening to a Mars Rover
Previously I wrote about using radio telescope arrays to look for aliens and today I have even more to say on the topic.
What is a Radio Telescope Array Again?
It’s a bunch of radio telescopes that are all pointed in the same direction. A radio telescope takes measurements in the form of complex numbers. These are voltages, but I prefer to just think of them of big 2d arrays of complex numbers. You get a voltage for each frequency, and you take measurements repeatedly over time, so you can index your array by time and frequency dimension.
Complex Vectors
These complex numbers mean something. A clear, real radio signal comes
in to an antenna looking like a wave. Not like an ocean wave or a sine
wave where it just goes up an down. A complex wave. It’s like the
value is spinning around in a circle. It starts at 1, it spins
around to i, it spins around to -1, it spins around to -i, it
spins back around to 1, and then the wave continues.
The nice thing about having a radio antenna array is that for a real radio signal coming from outer space, you should pick up that signal in all the arrays. So if you pick up a signal in half of the arrays and not in the others, it’s coming from somewhere on Earth. Maybe it’s coming from somewhere a lot closer to some of the antennas than others. Maybe it’s interference coming from a loose wire inside just one of the antennas. Who knows, but it’s some sort of interference and you can skip it.
There’s more, though. You should pick up the same signal in all the arrays. With one difference - some of the arrays are closer to the target. This is true even if your target is a pulsar halfway across the universe! The radio signal will arrive at some antennas nanoseconds before the others, and this means that the complex numbers you get will be different. But they will be shifted by the same amount over time.
This means, if you treat the sequence of voltages as a complex vector, the vectors you get from the different antennas should have… a complex correlation coefficient whose absolute value is very close to 1. I wanted that sentence to be simpler but I think it would lose something. If these were real vectors, you would just say, they should have a really small angle between them. They should be pointing in the same direction. Since they’re complex vectors you have to be a bit more fidgety about the math, when exactly you take the absolute value, when exactly you transpose things. But you the reader can ignore that for now.
Pictures Please
The x and y axes here are the same, one row and column for each antenna. The cell color is the absolute value of the correlation coefficient - yellow is highly correlated, purple is uncorrelated.
Here’s what it looks like for a signal that the MeerKAT telescope picked up when I’m pretty sure it was just picking up some interference:
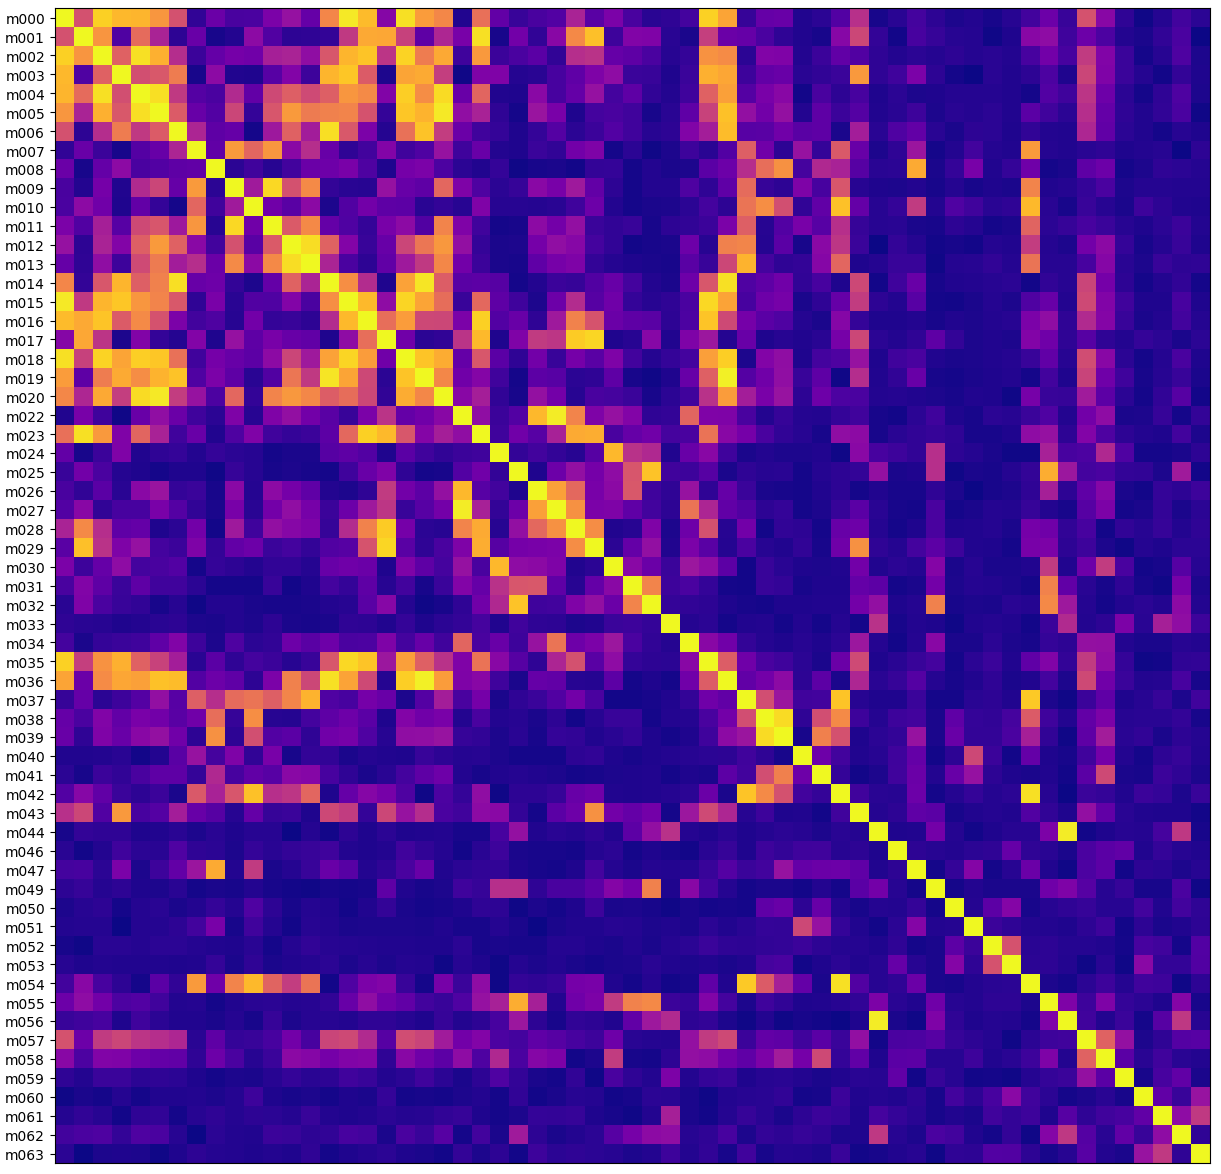
The left side has the names of the antennas. They seem perversely named because not every antenna is online at any given time. Here m021 and m048 weren’t working for some reason. The diagonal line is yellow because every antenna is perfectly correlated with itself.
What’s interesting to me is that you can see some square-ish patterns, like m038 and m039 are very highly correlated. And in fact if you check out a map of the MeerKAT facility you can see that antennas m038 and m039 are right next to each other. Great - this looks like RFI, something close enough to Earth that a distance of hundreds of meters changes how the signal is received.
For comparison, this shows a real signal, that the Allen Telescope Array picked up from a Mars rover.
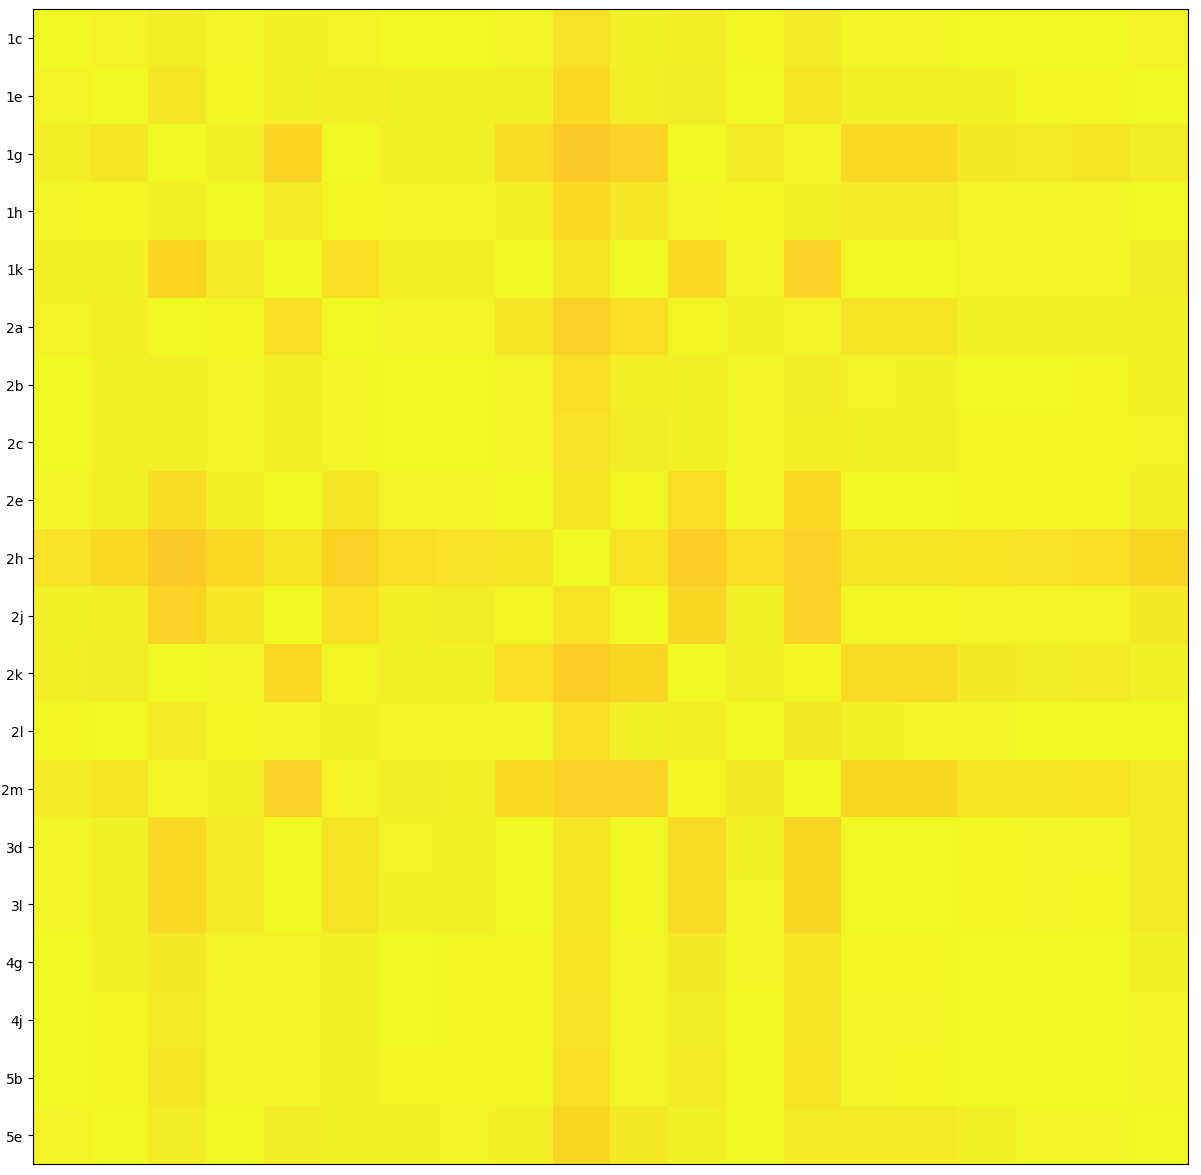
Everything is very correlated. This is clearly picking up the “same thing” on the different antennas.
Now What?
All the formulas here are pretty standard stuff in radio astronomy world. There isn’t a great theory for “what interference looks like”, but there are a lot of great theories for “what real signals look like”. Real data is the opposite - we don’t have a lot of real data from alien signals, but we have lots of data with radio interference in it. So we have to test out a bunch of theoretically justified metrics and see for which one the interference rarely matches the real-signal-theory. That’s what these charts represent to me, a demonstration that the correlation metric is effective in practice at differentiating interference from signal.
But the neat thing isn’t being able to differentiate signal from noise, it’s being able to do this “at scale”, so that we can run this signal processing continuously as the radio telescope records data at 200 gigabytes per second.
We’re not there yet. This correlation metric isn’t fast enough to run in the “first pass” that runs on all the input data. I’ve been doing all this analysis on “second pass” data, which has already been filtered down by other algorithms. Which is okay, but, first pass is better. So we are going to need a slightly different metric….