Lines And Squiggles
I previously wrote about searching for signals from other planets in radio telescope data, and thought I’d write about my current thinking.
We have lots of data coming in from the Green Bank telescope, and some other folks and I have been working on the data pipeline. Rather than collecting lots of data and having grad students manually analyze it months or years after the fact, we want to have the whole analysis pipeline automated.
I think for both scientific projects and corporate ones, the best part about automating your data pipeline is not just that you save a lot of human work, it’s that making it easy to do an analysis makes it easy to do an iterative loop where you do some analysis, realize you should change a bit of how it operates, then redo the analysis, and repeat to make your analysis smarter and smarter.
Current Problems
The best way for checking radio telescope data for this sort of signal over the past ten years or so has been a “cadence” analysis. You expect a coherent signal from another planet to look like a diagonal line on the radio telescope data. But you sometimes also get squiggles that look like diagonal lines from noise. So you point the telescope in a “cadence” - toward planet A, then toward random other target B, then back to A, then to random other target C, in a total of an ABACAD pattern.
The traditional algorithm is you write something to detect how “liney” a particular area is, and then you look at the cadence to find a sequence that goes, line, not line, line, not line, line, not line. And then everyone writes lots of papers about how precisely to detect lines amidst a bunch of other noise.
So in practice if you just set your threshold for “lininess” very high, you can get less data to look through, and so you just raise that threshold until the total output is human-manageable. I think in theory this is not quite the right thing to do - there end up being cases where you would clearly evaluate a single image as a line that are below this threshold. Lowering the threshold, though, you get false positives like this:
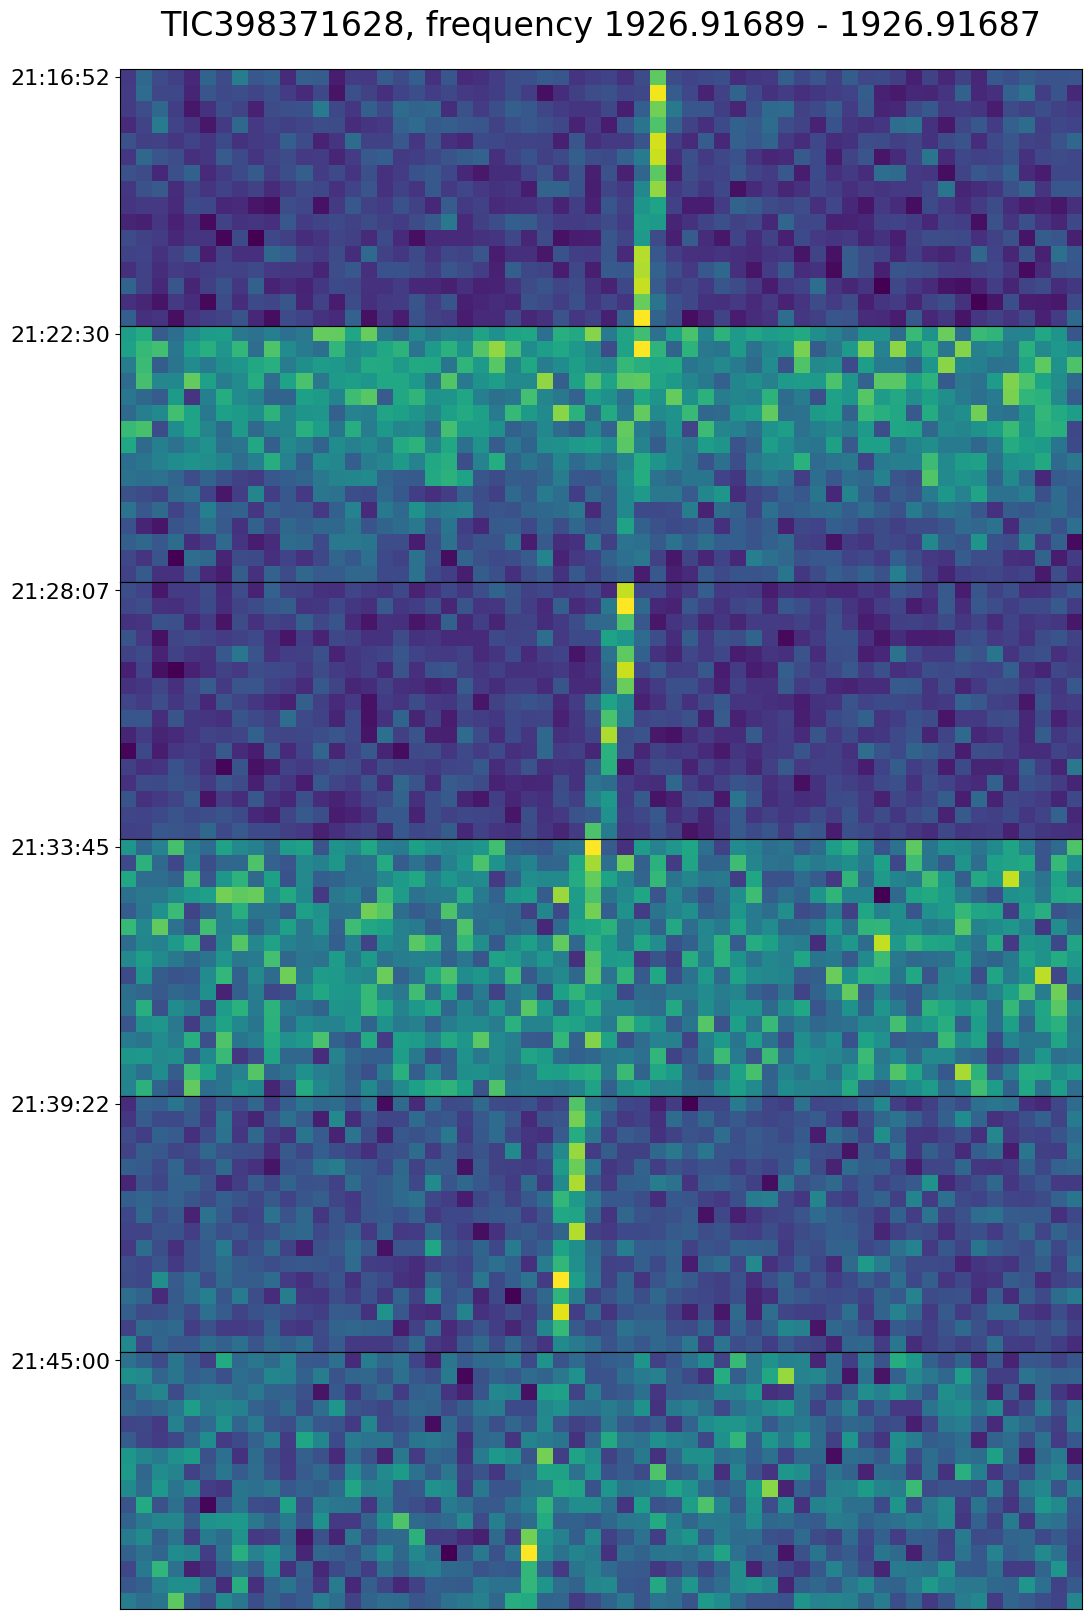
This is essentially a “threshold effect” - if we just categorize line versus not-line, then wherever we set the threshold, there will be some region that is noisy enough that the lines are only detectable half the time. And then in 1/64 of those cases, the coins happen to flip heads-tails-heads-tails-heads-tails and it looks like a cadence. But, humanistically, we see, oh this is really one single line that spans through all six of these images.
Maybe what we need to be doing is, rather than a two-way classification of “line” versus “not line”, we do a three-way classification of “line” versus “squiggle” versus “nothing”. And then for a cadence we really want line-nothing-line-nothing-line-nothing, maybe we would also be interested in line-nothing-squiggle-nothing-line-nothing, but line-squiggle-line-squiggle-line-squiggle is just uninteresting.
Maybe this example is more a “dot” than a “squiggle”, but I think in practice dots and squiggles are pretty similar. Both of them are things that don’t really look like lines, but also don’t really look like nothing, so it would be an unusual coincidence for one of them to occur where we expect nothing.
Perhaps I’ve lost all my readership at this point, but this is one of those blog posts where the primary value is clarifying my own thinking rather than educating you the reader per se.
Another way of thinking about this problem is, traditional methods of training a classifier don’t really make sense when your labeled data is all negatives. We need to break it down into sub-problems where we actually do have negative and positive examples. But we are breaking it down into the wrong sub-problems, because we need to be able to convert every vague sense of “we should have been able to automatically exclude this case” into an error in sub-problem classification.
To be continued…